Case study · Campaign measurement
Airline Loyalty Program
The campaign added 281 members and 11 points of flight activity.
- Scale
- 16,737 members · 389,065 member-months
- Role
- Sole analyst — raw extract to dashboard
Context
An airline ran an acquisition campaign for its loyalty programme in February–April 2018. Enrolments for the year came in 54% above 2017, and that’s the number that would normally go in the review deck.
But “enrolments were up 54%” and “the campaign produced 54% more members” are different claims, and only the second justifies running it again. Crediting the whole difference to the campaign assumes flat enrolments, and the programme was already growing.
The data
A public dataset of 16,737 loyalty members, expanded into 389,065 member-months, with enrolment date, cancellation date, monthly flight activity and customer lifetime value.
One thing in the cancellation data needed explaining first.
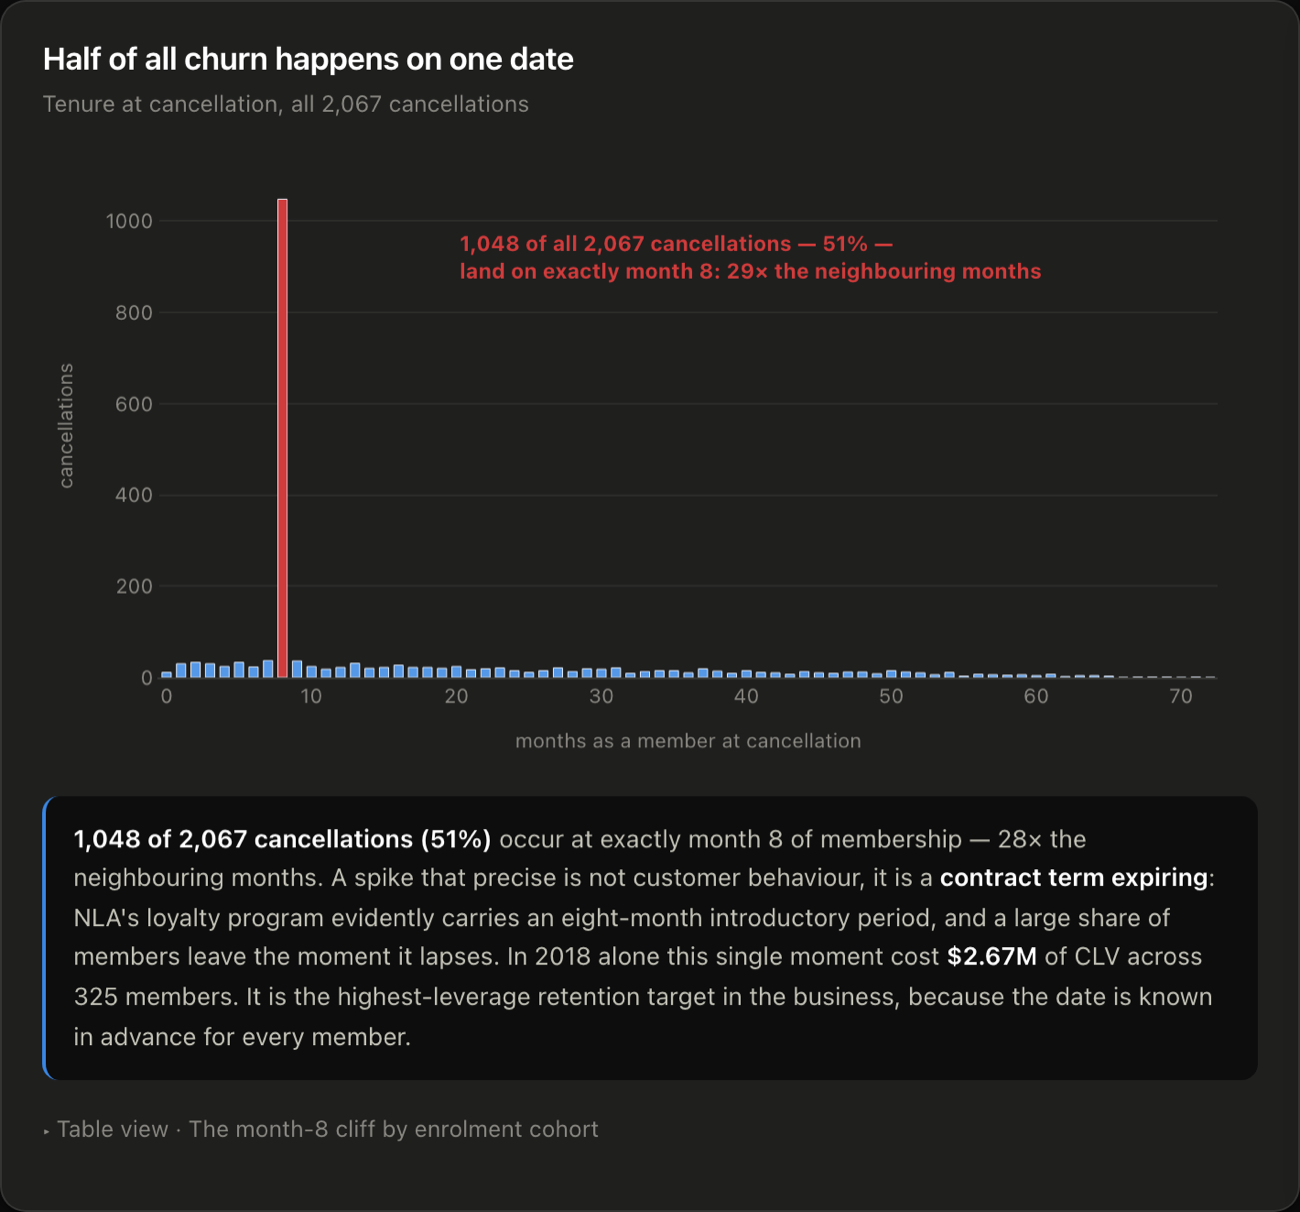
1,048 of 2,067 cancellations, 51%, fall on exactly month 8 of membership — 29× the neighbouring months. A spike that sharp is a contract term expiring: the programme has an eight-month introductory period, and a lot of members leave the moment it ends.
That changes what the churn numbers mean — any “average tenure” here is really just the length of the intro period. It’s also the best retention target in the business, because the date is known in advance for every member. In 2018 that one moment cost $2.67M of CLV across 325 members.
Approach
I measured 2018 against a trend-adjusted counterfactual: what the programme would have enrolled on its existing trajectory, subtracted from what it actually enrolled. That gives +281 incremental members, or +40.7%.
Against a $332 acquisition cost and a mean CLV of $8,047, the campaign pays back comfortably even on the smaller number — which is why it’s the number worth quoting.
The second question is what the campaign did for members already enrolled, who can’t show up in an enrolment count.
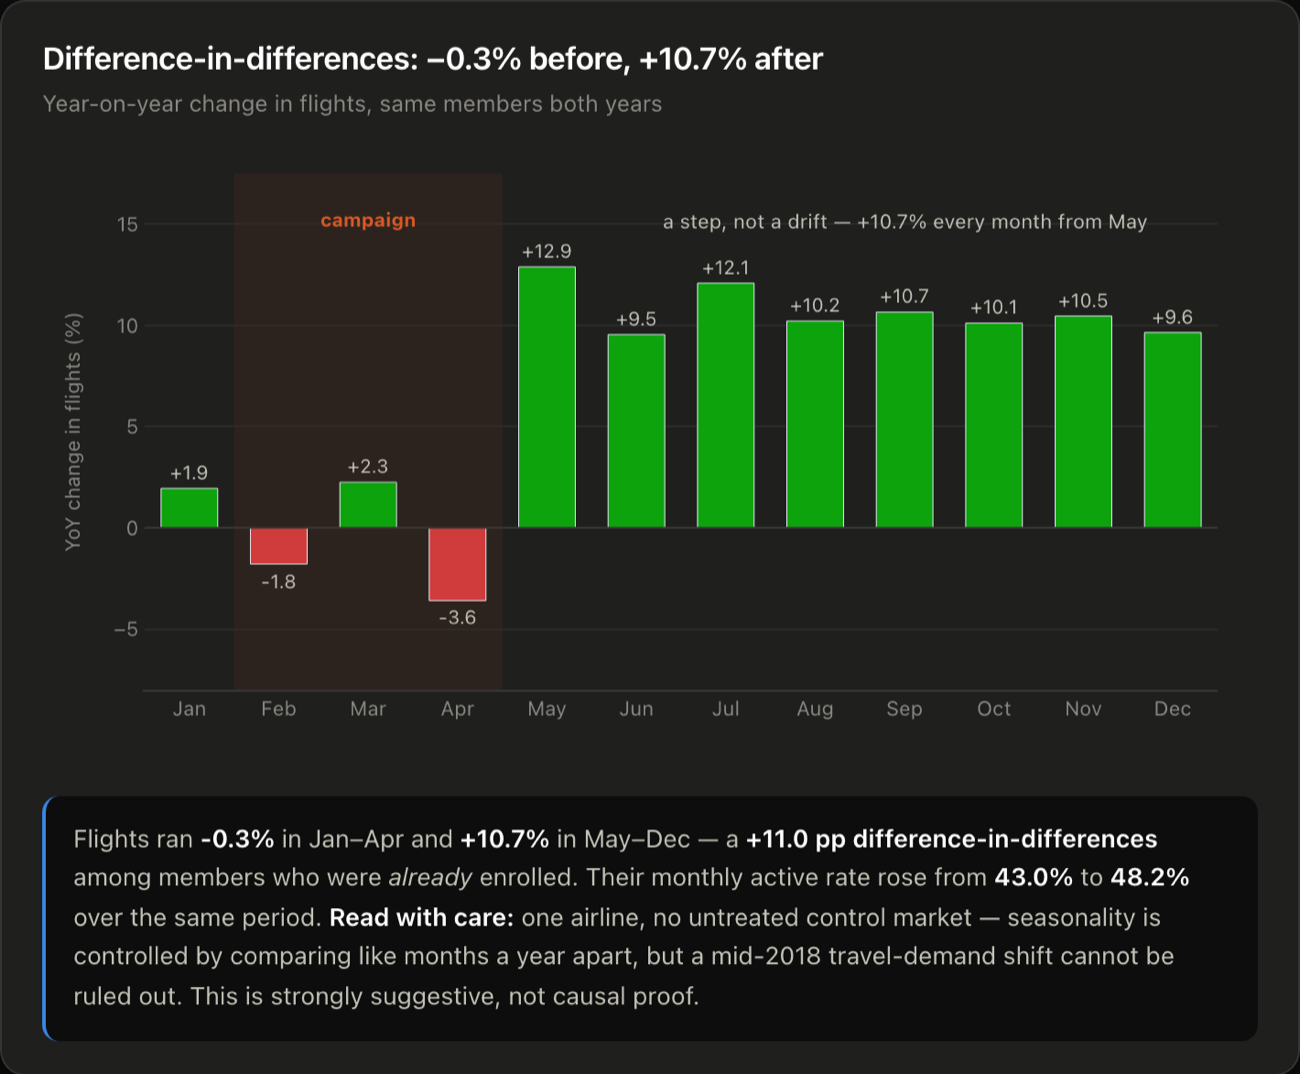
Year-on-year flight activity for that group ran −0.3% across January–April and +10.7% across May–December: a +11.0 percentage-point difference-in-differences. Their monthly active rate went from 43.0% to 48.2% over the same period.
The shape matters as much as the size. A step at May is what a one-off intervention looks like; a slowly improving market would show a gradual climb.
Air travel is heavily seasonal, so comparing May–December against January–April within 2018 would have measured summer. Differencing against the same months a year earlier strips out anything that repeats annually.
Result
+281 incremental members (+40.7%), $332 CAC against $8,047 mean CLV, and +11.0pp of flight activity among members who were already enrolled.
The campaign worked, at about three-quarters the strength the raw comparison suggested. +40.7% is the benchmark the next campaign gets judged against.
The month-8 cliff is the bigger prize. The lapse date sits on every member record already, so I’d put a retention contact and a renewal offer in front of it a month out.
One airline, no untreated control market. Comparing like months a year apart controls for seasonality, but a general shift in travel demand in mid-2018 would look identical to a campaign effect here.