Case study · Margin
Maven Toys México
The chain bought 30.9% revenue growth with 3.35 points of margin.
- Scale
- 829,262 transaction lines · 50 stores · 29 cities
- Role
- Sole analyst — raw extract to dashboard
Context
A 50-store toy retailer across 29 Mexican cities grew revenue 30.9% year on year. Gross profit only grew 16.0%.
That gap needs explaining before the next buying cycle. If products are selling at worse margins, it’s a pricing problem. If the shops are selling more of the cheap stuff, it’s an assortment problem.
The data
A public dataset of 829,262 transaction lines from 50 stores across 29 cities, joined to a product table with cost and retail price, and a store table with location and opening date.
Cost comes from the product record rather than the transaction line, so gross profit is calculated at current cost. Any mid-period cost change gets applied backwards across the whole history.
Approach
Gross margin fell 3.35 percentage points. A margin move has two possible sources: you sold a different mix of things (mix), or you sold the same things at different margins (rate). The job is to split the decline between the two.
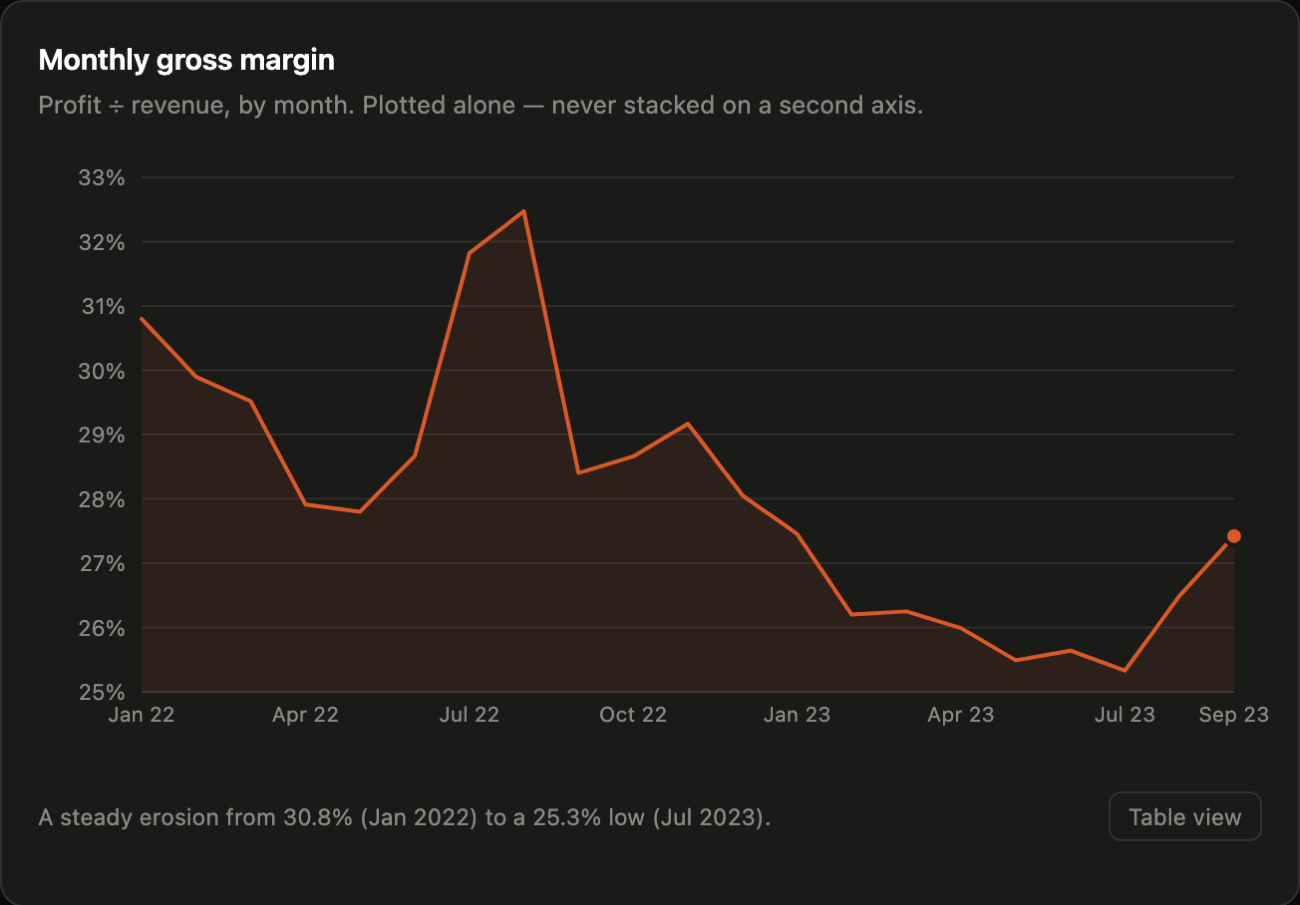
I ran an exact mix-vs-rate bridge at category level. It put 100% of the −3.35pp decline on mix, with a rate effect of exactly zero — category margins didn’t move at all.
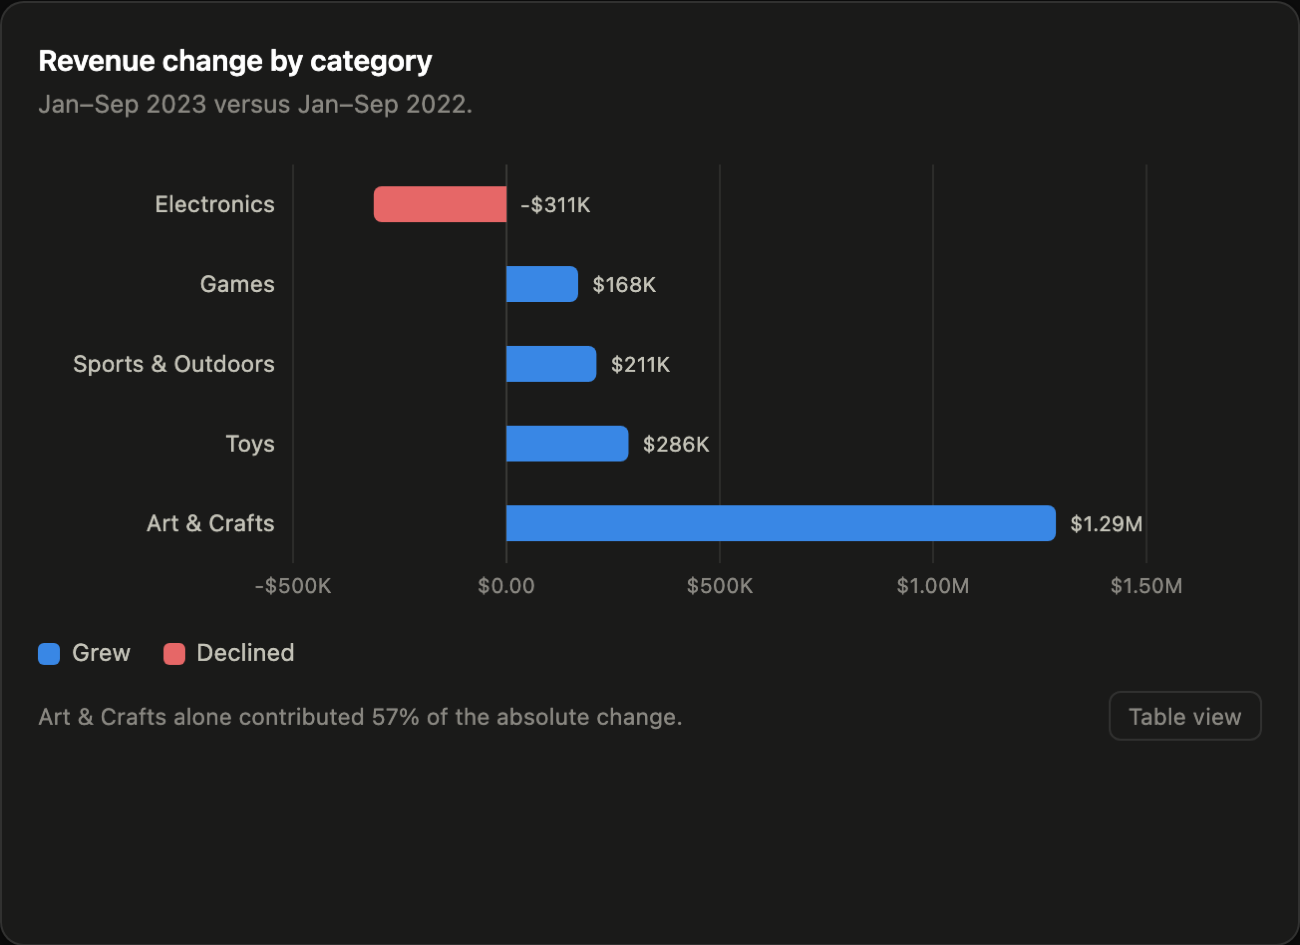
Art & Crafts grew $1.29M year on year while Electronics fell $311K: a swing of more than $1.6M between two categories that earn very different margins.
The bridge has to sum to the observed −3.35pp, which is what makes it checkable: the chart shows the mix moved, not how much of the margin it explains.
Result
All 3.35 points of margin decline attributed to mix. Rate effect: zero.
The chain bought its growth with margin, and the bridge says how much it paid. The fix belongs with assortment and promotional planning — a price response would have been aimed at a rate effect that isn’t there.
The monthly series shows the same erosion, from 30.8% in January 2022 to 25.3% in July 2023, recovering to 27.4% by September. Whether that recovery was deliberate or the mix drifting back is the first thing I’d ask.
For the buying team, the practical version is a margin-mix target sitting next to the revenue target.
A mix-vs-rate bridge is an accounting identity, not a causal claim: it locates the margin decline without explaining why the mix shifted in the first place.