Case study · Growth decomposition
Coffee Shop Sales
Revenue doubled on footfall alone. The AOV baseline was 27% too low.
- Scale
- 149,116 transaction lines · 3 NYC stores · 6 months
- Role
- Sole analyst — raw extract to dashboard
Context
Three coffee shops in New York more than doubled revenue over six months. Before anyone credits the new menu or the marketing, it’s worth checking which lever actually moved.
Revenue is Orders × Average Order Value. More people through the door is a location and hours problem; a bigger basket is a menu and pricing problem. Which one grew decides where the next effort goes.
The data
A public dataset of 149,116 transaction lines across three stores over six months, with timestamp, store, product, unit price and quantity.
The grain was wrong. transaction_id looks like an order ID
and was being used as one, but it identifies a line item — a customer buying a
latte and a croissant produces two “transactions”. Average order value was coming out at
$4.69; grouping the lines back into orders puts it at $5.98, 27% higher.
$4.69 is a believable average for a coffee shop, which is how an error like this sits in a dashboard for years, quietly breaking every metric with an order count underneath.
Approach
Revenue = Orders × AOV. Split it, and look at each part on its own.
Over the six months, orders grew 104% while average order value moved −0.1%. That turns “why is revenue up” into “what’s bringing more people in, and can we do more of it”.
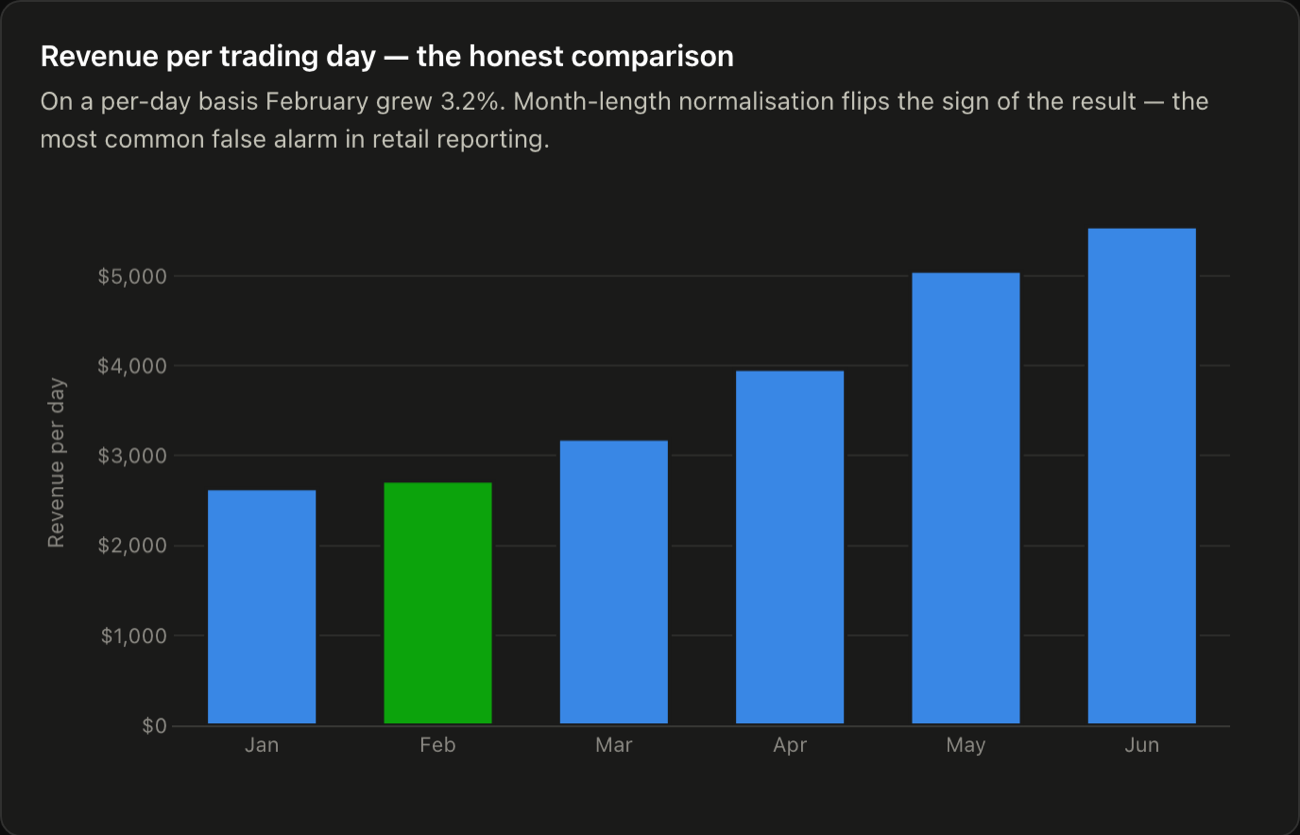
The other correction was the time comparison. A straight month-over-month total makes February look like a decline, purely because it’s three days shorter than January.
Result
Growth was 100% traffic and 0% basket — and the true AOV was $5.98, not $4.69.
The corrected AOV replaces $4.69 as the baseline for every metric that divides by order count. And the effort belongs on footfall — six months of trading didn’t move basket size at all.
The traffic itself turns out to be heavily concentrated.
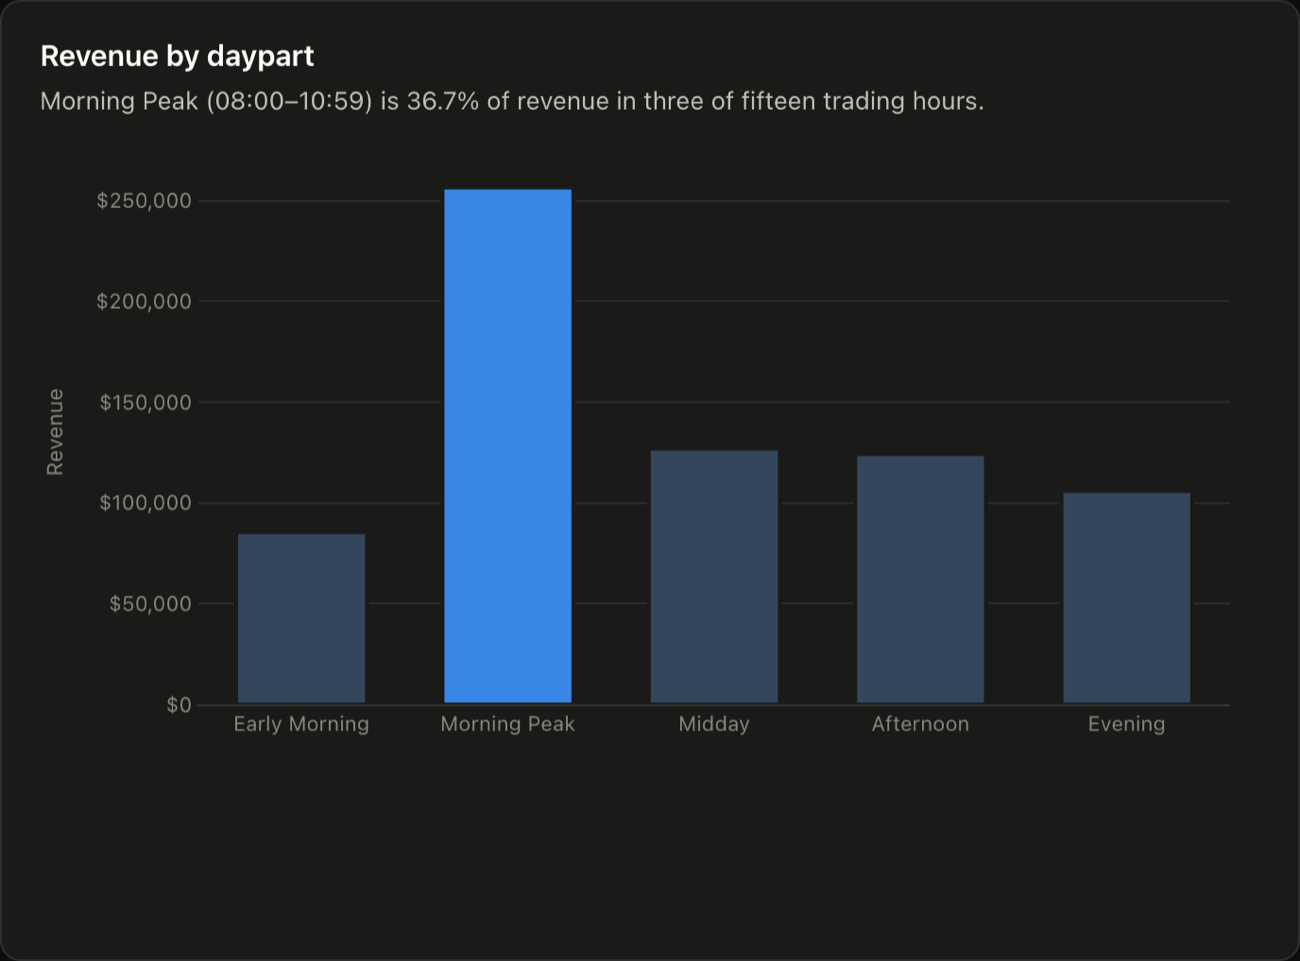
I’d point staffing and counter throughput at those three hours first, since that’s where a queue costs the most, and treat the quieter parts of the day as a separate question.
Six months of trading from one business, with no control period and no price history. The split describes how the growth arrived, not what caused it.